Thematic maps and dashboards provide information in a way that is as accessible and simple as possible in a simple, fast and comprehensible way. By combining layers and views through individual indicators, it is possible to bring the given thematic content closer to the user.
Thematic maps People and work, Unemployment, people and business, Spatial information about COVID-19 and Tourism are created in the map client mViewer, others through Javascript libraries – OpenLayers and Leaflet.
Industrial parks and investment potential of PSK
 In this thematic map, you will find a basic overview of the region and the possibilities of using industrial parks located in Prešov self-governing region. Industrial parks included in the map are from SARIO database (Slovak Investment and Trade Development Agency).
Microprogram PSK 2020
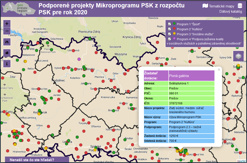 The thematic map shows supported projects of applicants for a grant from the PSK Microprogram from the PSK budget for 2020 to finance projects implemented to support public life of cities, municipalities, legal entities, interest groups of citizens, non-profit organizations and other eligible applicants in districts of the Prešov self-governing region. The map also includes a polygon layer showing the amount of allocated funds per 1,000 inhabitants (31.12.2019, source: Statistical office of SR) by district. The distribution of grants was approved by the PSK Council on June 22, 2020. Applicants can apply for a grant from the Sports, Culture and Social Services programs, where:
– minimum amount of subsidy per application = 700 €,
– maximum amount of subsidy per application = 10 000 €,
– co-financing of the supported activity = min. 20% of the approved subsidy (refund system).
Tourism
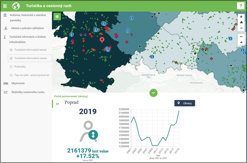 The map shows tourist attractions and points of interest of various types, tourist infrastructure and tourism statistics. The primary recipients are residents and visitors to the region looking for information on tourist opportunities in the region The main data source for tourist attractions is OpenStreetMap – an open project based on collective cooperation and the concept of Open source, which aims to create free geographic data (contains only the data that the community of contributors uploaded to the database). Other owners of the data (sources) shown on the map are the Prešov self-governing region, the Statistical Office of the Slovak Republic, the Regional Tourism Organization (Northeast Slovakia) and the University of Prešov.
Spatial information about COVID-19 (Beta)
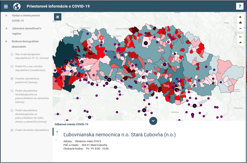 The map provides comprehensive information related to the “corona crisis”. In addition to the daily updated overview of confirmed cases of COVID-19, COVID-19 provides information on COVID-19 sampling points, disease-related health care. The map also displays PSK support points and risk demographic indicators that experts say may affect the spread of the disease or show a group of people at risk. or risk area. The main data sources are National Center for Health Information, Statistical Office of the Slovak Republic (datacube and SODB 2011), Prešov self-governing region and Roma Atlas 2019.
Transport network in Prešov region
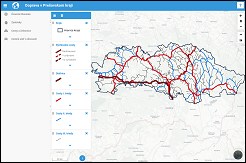 Thematic map shows line layers of highways, expressways, I., II. and III.class in the Prešov region. Part of map are also polygon layers showing the number of kilometers of each types of roads and the density of the road network by districts.
Prešov Self-Governing Region (PSK) manages 2nd and 3rd class roads since January 1, 2004. Road management and maintenance is the responsibility of the organization established by PSK – Management and maintenance of roads PSK.
Roma communities
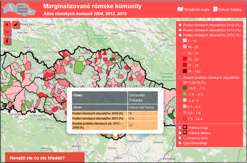 Improving the social and economic integration of Roma communities is one of the components of the European Commission’s Catching-up Regions initiative in Prešov self-governing region in cooperation with the World Bank. The aim is to define and propose integrated development programs for pilot municipalities that address priority areas in particular housing, education, employment, health quality, while also taking into account cross-cutting issues such as equal opportunities, combating poverty and preventing discrimination. For efficient fulfillment of activities in this component but also for the general public it is necessary and useful to have quality spatial data. This thematic map shows the proportion and number of Roma population in municipalities that are part of the Atlas of Roma Communities 2019.
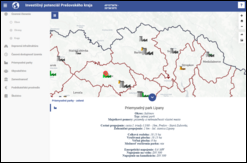
Poloniny Trail
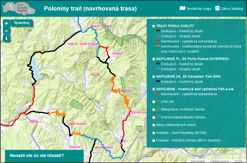 As part of the Catching-up Regions Action Plan outputs, PSK has committed itself to effectively supporting the development of the internal potential of tourism in the Poloniny National Park. For this purpose, World Bank experts designed “Poloniny trail” – the multipurpose tourist route, which will be connected to the network of existing cycling routes leading on local roads, tourist and cycling infrastructure. The creation of the “Poloniny tourist route” is based on the refurbishment and construction of soft and hard infrastructure, as a starting point for improving accessibility among municipalities and improving the current tourist and cycling infrastructure.
Grant flow – Call for Region 2019
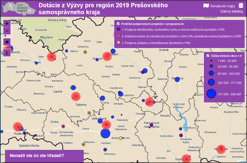 The thematic map shows the supported projects of applicants from the 1st and 2nd round of the Call for Region 2019 from the PSK budget and their distribution to municipalities. Entities can apply for a subsidy in three programs: Support for tourism infrastructure and restoration of cultural monuments in PSK, Financing of already approved projects within the 5% co-financing by ESIF applicants, Support for construction and reconstruction of sports grounds in PSK.
Emergency healthcare and pharmacies
The thematic map shows the location of emergency health care providers and pharmacies in the territory of the Prešov Region. The last data update: november 2019.
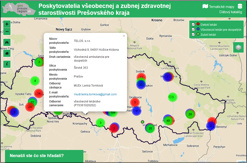
Outpatient healthcare
The thematic map shows the location of outpatient general and dental healthcare providers and also number of inhabitants over 24/ up to 24 years for one general practicioner /pediatrician per districts in Prešov region. The last update of heathcare providers: 10.3.2020 (Source: ÚPSK) and population: 31.12.2019 (Source: Statistical Office of the SR).
PSK organizations
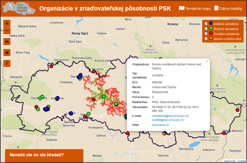 The thematic map shows the localization of organizations within the founding competence of the Prešov Self-Governing Region. These organizations include school (77), cultural (27), sanitary facilities (25) and organizations of PSK Road Administration and Maintenance Agency (8). Last update: november 2019.
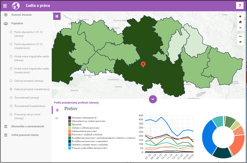
Unemployment, people and business
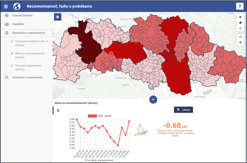 Through statistical information, the map provides a comprehensive overview of the structure of unemployment, population (demography) and the economy in general, primarily from the perspective of the employer, respectively. a potential employer (investor) who is the primary recipient of the information. Secondary recipients of information are local government representatives, citizens, academic and the third sector,. Through the map, it is possible to view the structure of job seekers by profession, education, duration of registration and selected demographic and economic indicators at the level of municipalities / districts. The map contains data from the field of demography, primarily at the level of towns and villages, through which the client will get a picture of the state and development of the population in the region. By combining layers and views, it is possible to see and analyze the state and development of individual indicators in time and space.
Life and work